
Diverge Media recently covered how influenza practically disappeared in Canada at the exact same time the spike from Covid began. Could the same scenario exists for the USA? Do their flu numbers also disappear at week 13 during the “pandemic”.
The data today – What happened to the American influenza data as Covid was introduced to the public? Well, in weeks 11 through 15 (March into spike of Covid that began in April) we see a significant drop in the percentage of positive flu tests in-spite of the increase in testing from previous years.
This is exactly what we reported on in our Article: Where’d the Flu go? — 2020 the year influenza almost disappeared.
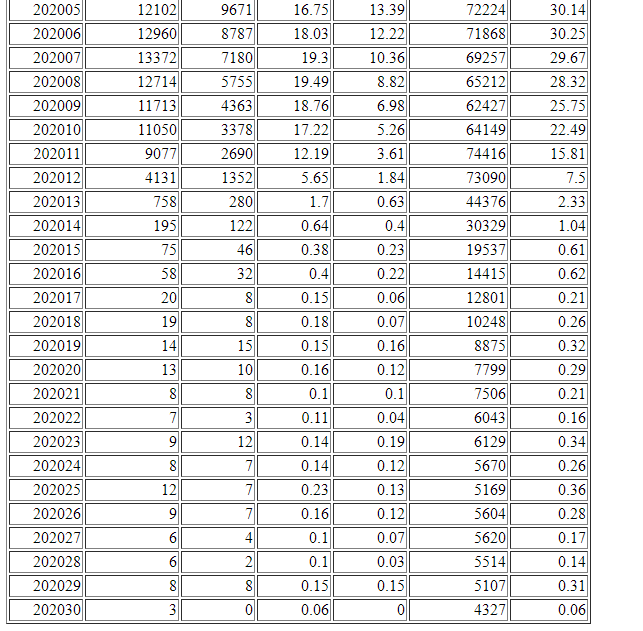
WK 11 (2020)
Tests performed: 74,416
percentage positive: 15.3%
WK 11 (2019)
Tests Performed: 34,780
Percentage positive: 26%
Positives test difference as percentage (2019-2020): 10.7% less positive tests in 2019 compared to the 2020 stats from same period. They performed 39,636 less tests in 2019 and still had 10.7% more positive tests.
WK 12 (2020)
Tests performed: 73,090
Percentage positive: 7.5%
Wk 12 (2019)
Tests performed: 31,045
Percentage positive: 22.1%
Positives test difference as percentage (2019-2020): 14.6% more positive tests in 2019 than in 2020. There was 42,045 more tests performed in 2020 and still 14.6% less positives even with this increased testing.
Wk 13 (2020)
Tests performed: 44,376
Percentage positive: 2.33%
Wk 13 (2019)
Tests performed: 29,407
Percentage positive: 18.1%
Positives test difference as percentage (2019-2020): 2020 had 15.77% less positives than 2019 even with 14,969 more tests conducted in 2020.
Wk 14 (2020)
Tests performed: 22,324
Percentage positive: 0.8%
Wk 14 (2019)
Tests performed: 26,127
Percentage positive: 15.1%
Positives test difference as percentage (2019-2020): 14.3% more positive tests in 2019 compared to 2020. In 2019 clinical laboratories tested 3803 more people compared to the 2020 season.
Wk 15 (2020)
Tests performed: 15,978
Percentage positive: 0.43%
Wk 15 (2019)
Tests performed: 22,526
Percentage positive: 11.8%
Positives test difference as percentage (2019-2020): 11.37% more positive tests in 2019 compared to 2020. 6548 more tests were performed in 2019 than in 2020. Where did the Flu go?

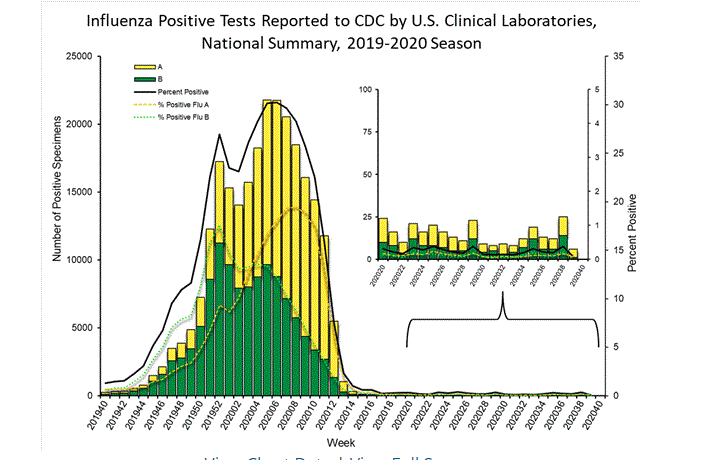
In weeks 11-13, many more influenza tests were conducted than what had been done in the previous year (2019), and still it turned out much lower numbers as a percentage of positives compared to the year prior. After week 13 we see the CDC’s testing for Influenza continually drop week over week – and positive samples become almost non-existent.
We know early on in the “pandemic” that governments around the world were classifying Covid like symptoms as Covid without confirmation (no test). This occurred during the “spike” of the “1st wave”. Is it possible that Covid numbers are inflated from the missing Flu statistics?
This story is continually developing – we will be releasing more stories like this one highlighting the missing Flu numbers of various countries from around the world.
Are we exposing something? Like and share if you think we are!
Make a one-time donation
Make a monthly donation
Choose an amount
Or enter a custom amount
Your contribution is appreciated.
Your contribution is appreciated.
