
It is time – that someone do the work to simply expose the governments narrative from their own data. Today’s article will show a simple but large hole in the governments narrative – every time they increased testing, positive “cases” seem to increase parallel to the testing. When you run a PCR test at 40 cycles, you’re simply telling people that they have something in them, not that their sick or infectious. Just ask Kary Mullis.
The following information was compiled from https://covid-19.ontario.ca/data. We compiled the data into excel charts to draw comparisons for our readers.
Breakdown of the charts:
- Blue bars represents cases
- Yellow represents tests
- Blue dotted line represents new cases as a trendline
- Grey Bars represents Deaths
- Left side is number of tests, right side is number of cases
This is followed by the data presented in chart form for the month.
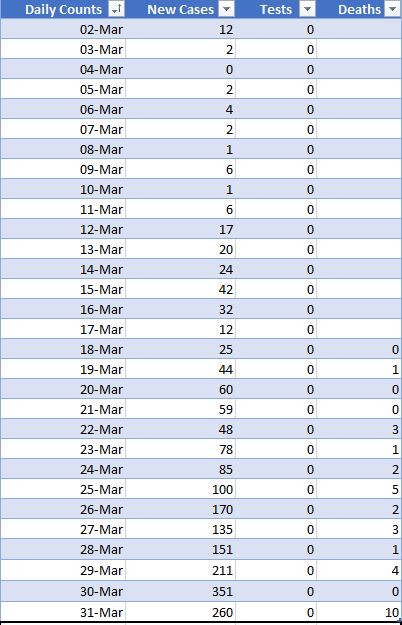
March cases vs tests
No testing occurred in this month, still cases were presumed positive. State of emergency declared and later in the month gatherings were restricted. There was 32 cases when a state of emergency was declared.

April Cases vs Tests
In the beginning of April we weren’t testing for Covid but cases were being lumped in as Covid cases. Testing begins on the 16th of April. We were testing roughly 9000 – 12000 in this month.


May cases vs tests
We moved into stage 1 of the re-opening plan May 19th as we were in a downward trend. Testing numbers fluctuate from roughly 5800 – 19,200.


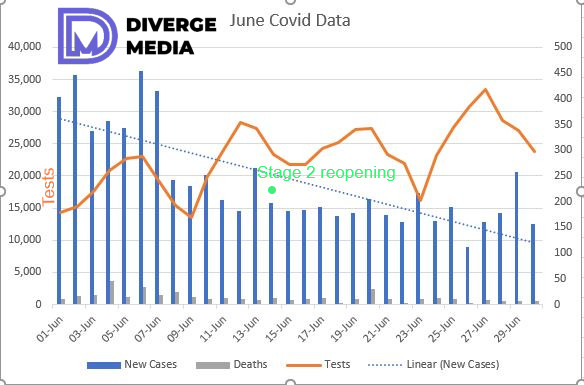
June cases vs tests
14th of June we entered into stage 2 re-opening as we were in a sharp decline of cases. Right before they do this they increased testing again. The weather begins to warm and cases decrease. Testing ranged from 13,500 -33,500 roughly.

July cases vs tests
After moving into stage 2 after a sharp decline in cases, the Ford government decided to mandate masks. Although July shows a general downward trend for cases, we see bigger spikes in cases on certain days compared to earlier in the month – after the municipal mask mandates came into effect. Stage 3 reopening occurs on July 24th. On the 30th of July it was announced students would return in September. Testing ranged from 15,000 – 31,000 roughly.


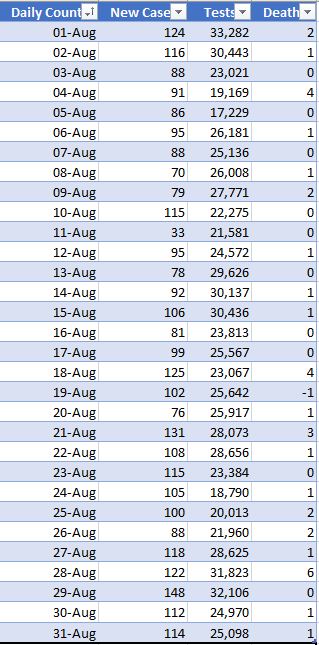
August cases vs tests
After the Mask mandate we see a upwards trendline in the new “cases” data. We can also see that overall testing was increasing during this time. Tests per day ranged from 17,200 – 33,200 roughly.

September cases vs tests
As our testing increased from roughly 15,000 on September 9th to roughly 35,000 per day at the end of the month we see a clear upwards trendline in new cases. Pharmacy testing comes into effect on September 25th and restrictions are placed on bars and restaraunts comes into effect on September 26th. Deaths are very low in September. Testing at beginning of the month is roughly 24,000 per day and at the end of the month it ends at roughly 38,000.


October cases vs tests
The province now makes masks mandatory on October 3rd. After the mandate we see a clear increase in the trendline for new cases even with a downward trend in testing. October 13th the province tells people to stay home. York moves back to stage to October 19th. Tests per day ranged from 24,000 – 46,200 roughly.


November cases vs tests
November shows that the governments tiered framework isn’t working at all. The trendline of new cases shows a clear upwards trend. The biggest day for cases is November 27th which coincidentally is the biggest day of testing (58,037). Tests per day ranged from 25,000 – 58,000 roughly.


Cases Vs tests + percentage positive by month
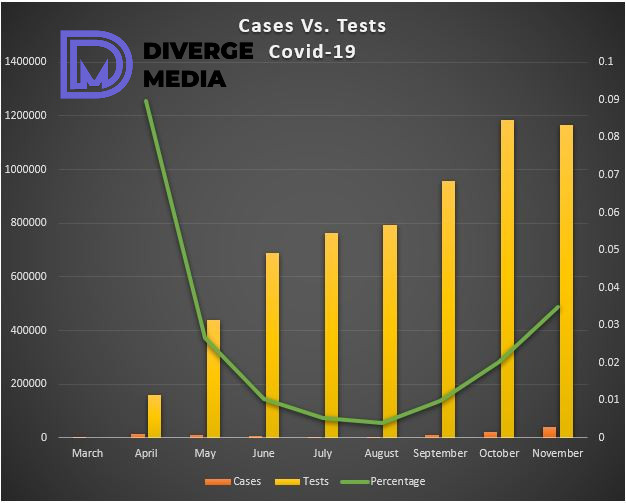
We can see that as we approach flu season with a increase in tests we also have seen an increase in cases. As we entered the warmer months we see a decrease in the percentage positive of cases – as you would expect.
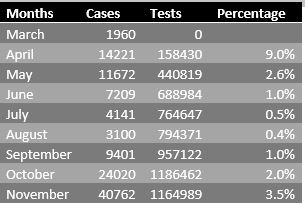
Explaining the percentage positive line – 0.01 represents 1% and the chart ranges up to 0.1 or 10%. April is high because for the 1st half of the month all cases were presumed positive without any testing. It is worth noting that many hospitals have implemented policies asking anyone staying in hospital to be tested for Covid. On a personal note this happened to a family member who was in hospital for completely unrelated health reasons and was tested even while unconscious every day. If she would’ve tested positive they would have marked her as a Covid hospitalization – and eventually a Covid death.
Article: Exposing the Covid Narrative – Setting the record straight
Article: How to fake a pandemic
Article: Where’d the Flu go? — 2020 the year influenza almost disappeared
Article: The Joke that is Covid-19 testing
Article: Everything wrong with mandatory masks
Deaths as a percentage of tests starting in month of March (top)
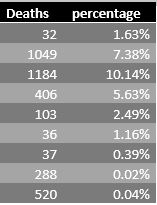
Perhaps the most damning of any of the data is the above chart that shows a steep decline in deaths as a percentage of tests done. Check out our other articles for perspective on this data. We have increased testing 3x the amount compared to the beginning of our handling of Covid. We are also amplifying our PCR tests to levels that can’t even be cultured to prove infectiousness – and decimating our economy and liberties and freedoms on this basis.
*Excel rounds to the nearest percentage point*
Diverge Media is an independent Canadian media company dedicated to bringing you the stories that matter. We do not, and will never receive funding from the government. If you would like to support our work, please do so by donating through the donation form below.
